


About
TELE | /ˈtelē/ | Remote, coming from |
GAUGE | /ɡāj/ | Device for measuring |
What is Telegauge?
Telegauge is an solution that gathers data from an industrial network, stores the data in a database, and displays the data with a serius of custom screens or HMI. Once the data is gathered, reports can be generated, or SMS alarms sent to the appropriate personnel.
Telegauge uses a device mounted on the industrial network which communicates with all the devices. Data collected by this device is stored in a database and syncronized to the cloud. Once the data is in the cloud, screens or dashboard cna be viewed from any device.
In short, it allows facility managers or operators to monitor their facility remotely, be notified of issues and view long-term data trends.
A Brief History
- Version 1 was a simple web page generated directly on the local device, refreshing every 60 seconds to provide up-to-date readings.
- Version 2 introduced traditional HMI-style screens, making the interface more user-friendly and visually informative.
- Version 3 was a major refactoring project, eliminating legacy code from Version 1 and incorporating lessons learned from Version 2 to improve performance and maintainability.
- Version 4, launched in 2017, marked another significant rewrite. This version leveraged modern browser-supported WebSockets, enabling data to be pushed instantly to screens rather than requiring frequent polling by the client. This greatly improved responsiveness and reduced network load.
- Version 5 is the boldest release yet, featuring a completely redesigned user interface, new features, and extensibility. The platform now supports modules such as "Project Tracking," allowing for future expansion and customization to meet evolving needs.
What can Telegauge monitor?
Telegauge collects data from both local industrial networks and select internet sources, providing a comprehensive monitoring solution.
While Telegauge began as a landfill monitoring tool, it has evolved into a flexible platform capable of monitoring almost any environment. Modbus is a leading protocol, but support for other major industrial protocols can be added as needed. Many smart home devices also integrate with Telegauge, giving homeowners a convenient dashboard accessible from devices like an iPad.
The most common industrial protocol used is Modbus, as it is widely adopted in Telegauge's original industry. Telegauge employs a proprietary poller for each connected device, communicating in its native protocol and continuously monitoring for data changes.
Protocols are essential for converting data from any source into a format suitable for display. Devices with web APIs, such as Wunderground or Fitbit, can also be integrated. If a service provides data via an API, Telegauge can collect and visualize it using customizable gauges and widgets.
What types of facilities can Telegauge monitor?
Telegauge is compatible with most industrial facilities, offering broad applicability across sectors.
Our experience includes monitoring the following types of facilities:
- Landfills
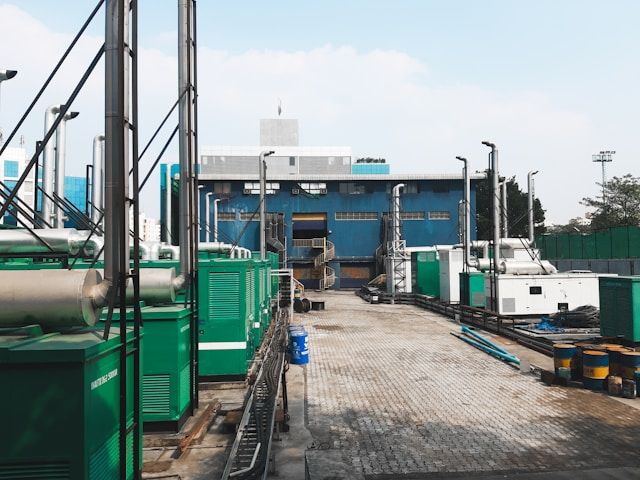
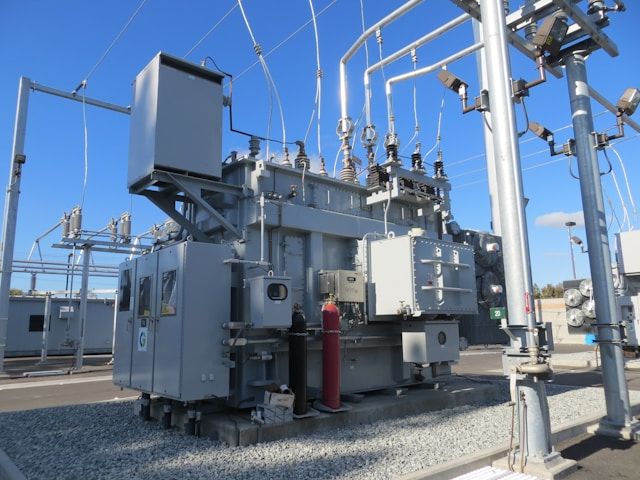
- Power plants
- Stand-alone generators
- Sewer treatment plants
- Breweries
- Hotels and resorts
- Cogeneration/CHP plants
- Wind turbines
- Solar panel arrays
As long as your facility or home supports common protocols such as Modbus, Telegauge is an excellent fit for your monitoring needs.
How is it monitored?
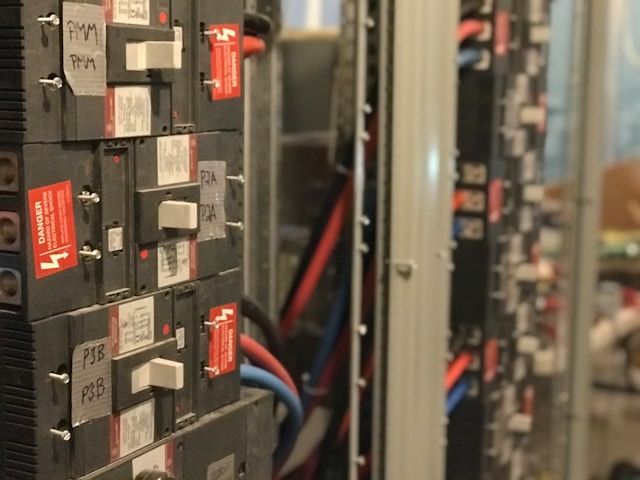
To monitor your facility, simply install a Telegauge Device on your industrial network.
The device runs multiple pollers, each supporting a different protocol. For example, the Modbus poller is configured with a list of all Modbus devices and continuously gathers data from each one. As new data is read, it is compared to previous values. If a change is detected, the updated data is instantly transmitted to the cloud server and to every open screen displaying that tag. If the value changes by a defined deadband, or remains unchanged for a set period, the data is written to the historical database for long-term storage and analysis.
How fast is it monitored?
Extremely fast!
Most data sources require regular polling to collect data. The polling rate is fully configurable. Telegauge can poll a device up to 10 times per second, though practical limits may apply for older protocols like Modbus. Each installation includes a tuning phase to determine the optimal polling rates for each tag and device in the system.
Starting with Telegauge 4, the system features subsecond latency between data collection and display, ensuring near real-time updates on all screens.
Where is the data displayed?
Data can be displayed anywhere, on any modern device.
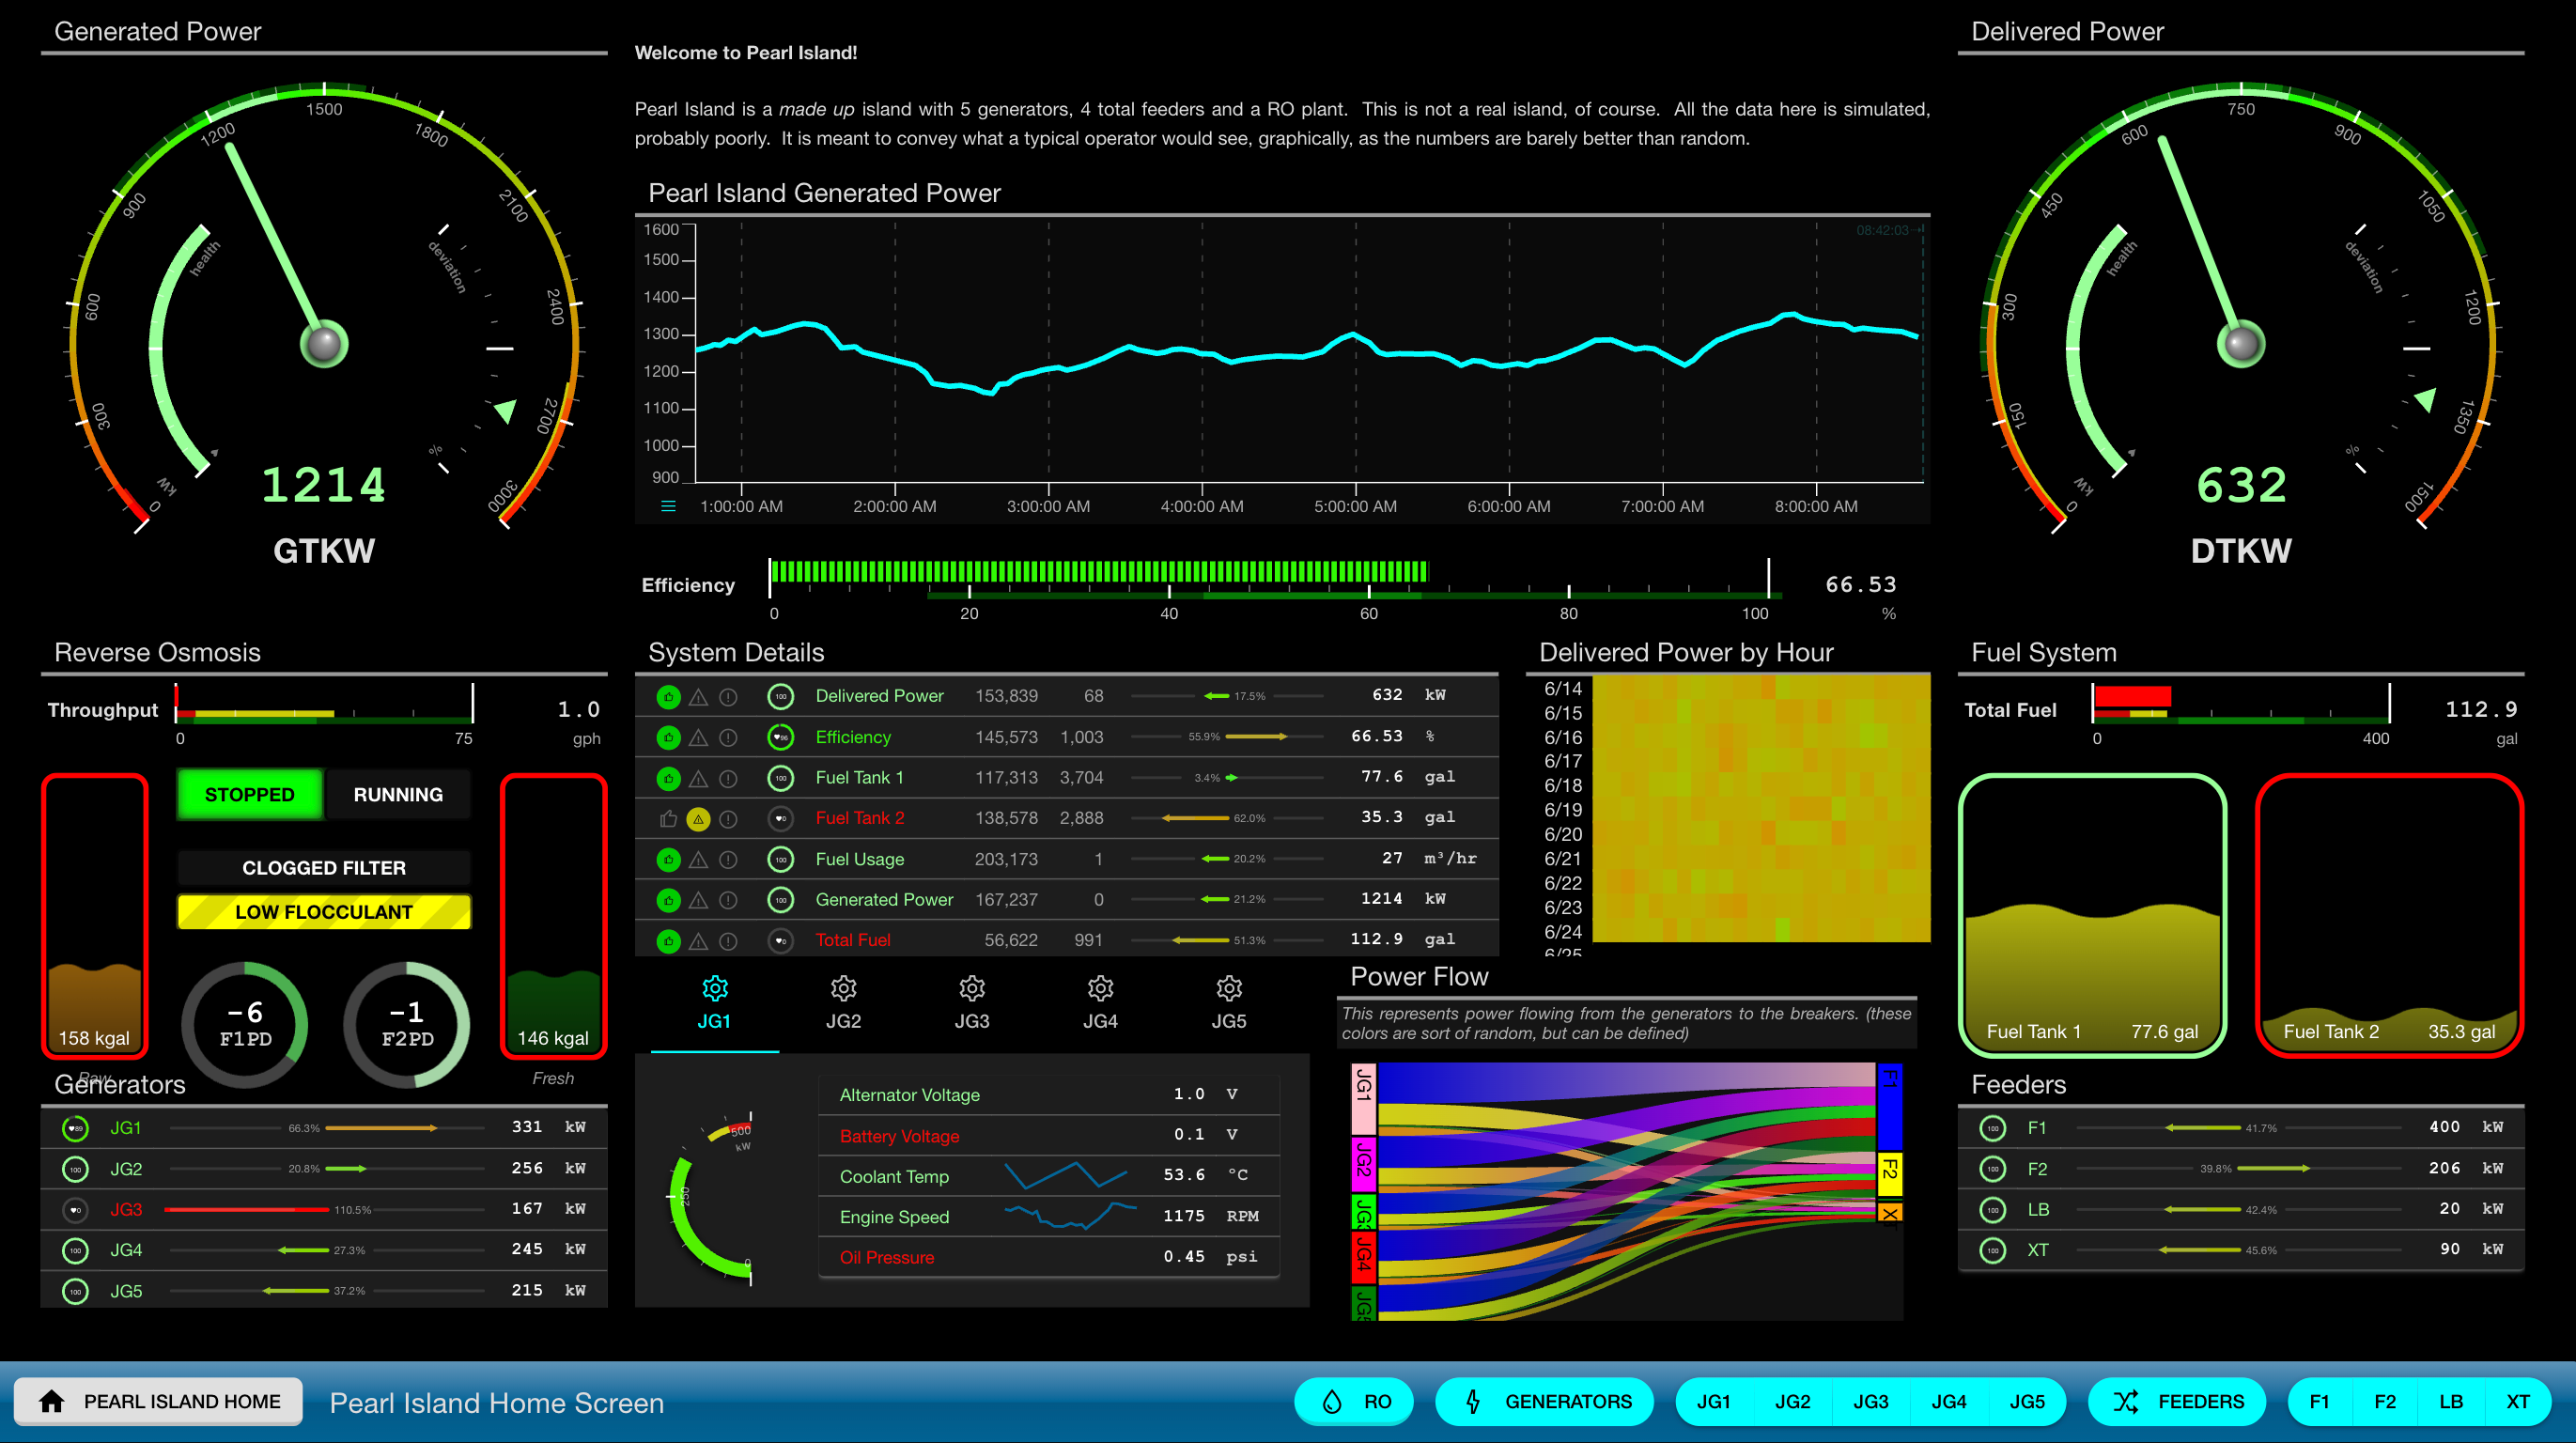
Telegauge uses HTML5-compliant techniques to render screens on everything from smartphones to large wall-mounted touchscreens. Each screen is populated with widgets, configured to display specific data. The Gauge widget is the most common—simply create a screen, add a Gauge, assign it to a tag, and the needle will move in real time as data updates.
Open your dashboard on your iPad, phone, or desktop for instant access to your facility's data, wherever you are.
Custom Solutions
Telegauge specializes in custom monitoring solutions. Our strength lies in gathering data from multiple sources and unifying it in a single database. This enables the creation of comprehensive screens covering an entire facility, unlike other solutions that are limited to a single vendor's devices.
If you have a unique or complex monitoring challenge, Telegauge can provide a tailored solution to meet your specific needs.